-
[Prometheus 개념] Metric Type 과 Label에 대해 알아보고 Custom Exporter(=Client Library with python)작성하여 값 받아보기데이터 엔지니어링/Prometheus 2022. 12. 21. 20:18반응형
Metric이란?
메트릭이란 숫자 측정임. 시계열은 변경 사항을 시간 단위로 기록됨을 의미함. 애플리케이션의 특정 방식으로 작동하는 이유를 이해한 느데 중요한 역할을 함. 예를 들어 DB가 속도가 늘어졌다고 하면 쿼리의 작동 수는 얼마나 되는지 활성 사용자는 몇 명인지 등의 내용을 시간대 별로 쉽게 파악할 수 있음.
Lable란?
Lable은 Key-Value의 쌍을 얘기함 Prometheus에서 Lable은 Key-Value를 이용하여 특정 내용을 서칭하는 용도로 사용된다.
Prometheus에서 Metric 표기법
- 기본 작성법 - <metric name>{<label name>=<label value>,...}
- 예시 - api_http_requests_total {method="POST", code="200" , handler="/messages"}
- Metric = api_http_requests_total
- lable = method, code, handler
Metrics Type
Prometheus에서 지원하는 타입이 여러 가지 존재한다.
- Counter
- 누적 메트릭 타입 Scrape이 실패하더라도 누적된 내용만 보고 싶을 때 사용한다.
- 하지만 인스턴스의 재시작 등을 카운터가 초기화되면 Counter는 0부터 다시 시작된다.
- Gauge
- 스냅숏 하는 메트릭임. 실시간 메트릭에 유용하며, CPU 실세 사용량, DB 활성 유저수 같은 곳에 사용된다.
- 그때 당시의 값을 가져오므로 시스템의 문제가 발생할 시 데이터가 끊어지는 속성이 있다.
- Summary
- 히스토그램과 유사하지만 정확한 계산 비용이 발생하며
- 분위수 단위에 계산값을 볼 때 사용한다.
- Histogram
- 버킷단위로 그룹화하여 구간별 데이터의 특화되어있다.
- 히트맵이나, 구간별 분포 같은 그래프를 그릴 때 사용한다.
Custom Exporter 만들어 보기
Prometheus에서는 Collector를 이용하여 정보를 시계열 데이터를 받아오는데, Counter, Gauge 등을 개별로 생성하여 주어도 되고 Collector자체를 만들어 사용하여도 된다.
Custom Collector를 이용한 Exporter 만들기
random값을 주는 Collector를 만들어 주면 아래와 같이 만들 수 있다.
import time
import random
from prometheus_client.core import GaugeMetricFamily, CounterMetricFamily, REGISTRY
from prometheus_client import start_http_server

class myCustomCollector(object):
    def __init__(self):
        pass

    # Collect 함수를 꼭 만들어 주어야 Start_http_server에서 사용함
    def collect(self):
        # Gauge 만들기
        g = GaugeMetricFamily("random_number", "Gauge - Number Generator", labels=["randomNum1", "randomNum2"])
        # Gauge 값 넣기
        g.add_metric("",random.randint(1, 20))
        g.add_metric(["First"], random.randint(1, 20))
        g.add_metric(["","Second"], random.randint(1, 20))
        g.add_metric(["First", "Second"], random.randint(1, 20))
        yield g

        # Counter 만들기
        c = CounterMetricFamily("random_number_2", "Counter - Number Generator", labels=["randomNum1", "randomNum2"])
        # Counter 값 넣기
        c.add_metric("", random.randint(1, 20))
        c.add_metric(["First"], random.randint(1, 20))
        c.add_metric(["First", "Second"], random.randint(1, 20))
        yield c

if __name__ == "__main__":
    port = 9000
    frequency = 1

    # Exporter 서버 시작하기
    start_http_server(port)
    # CustomCollector 등록
    REGISTRY.register(myCustomCollector())

    while True:
        # period between collection
        time.sleep(frequency)
실행하기
아래 코드를 실행하면 Http 서버가 하나 만들어진다.
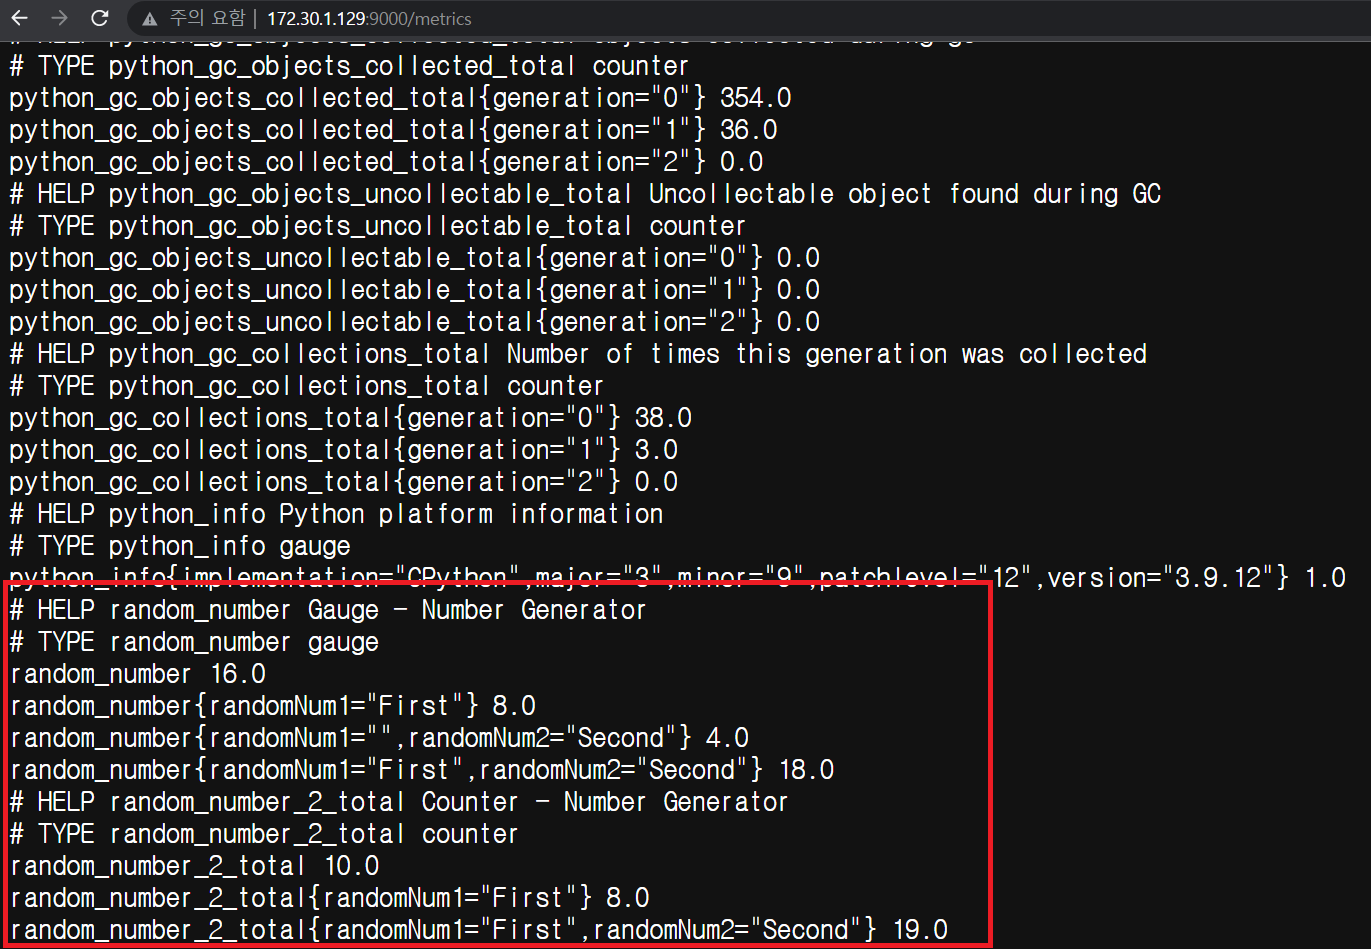
python ./customCollector.pyHttp로 들어가 Collector 정보 확인하기
아래 random_number, random_number_2_total이라는 metric이 생성된 것을 알 수 있고, 레이블 단위로 값이 변경되어 들어온 것을 알 수 있습니다.
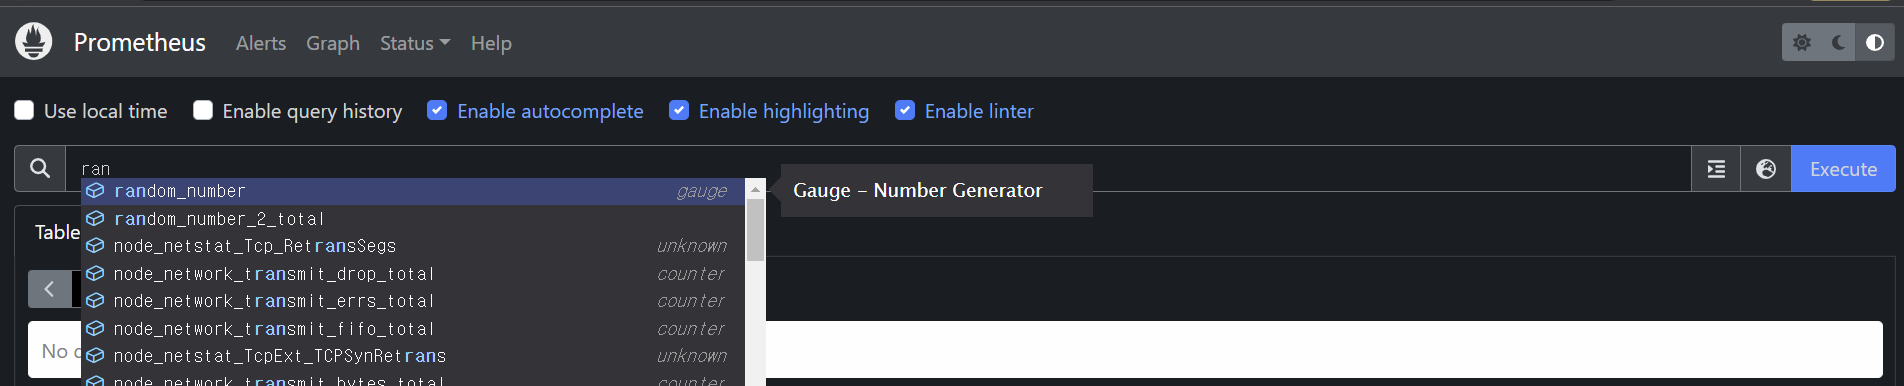
Prometheus에서 Metric 확인하기
Prometheus에서 Metric 확인하면 아래와 같이 나오는 것을 확인할 수 있음

개별 Collector 만들어서 Exporting 하기
Custom Collector로 만들어서 사용해도 돼지만 개별 객체로 만들어서 사용해도 됩니다. 아래는 Custom Counter 만든 예제입니다.
import time
from prometheus_client import start_http_server, Counter

c = Counter(
    name="counter_test",
    documentation="This is Custom Counter",
    labelnames=["first", "second"])

if __name__ == "__main__":
    port = 9000
    frequency = 1

    c.labels(first='1', second='2').inc(1)

    start_http_server(port)

    while True:
        # period between collection
        time.sleep(frequency)
Http로 들어가 Collector 정보 확인하기
아래 그림처럼 Counter_test_total, Created Metric이 생성된 것을 확인할 수 있습니다.

Prometheus에서 Metric 확인하기

마치며
Metric을 Custom형식으로 자신에게 맞게 만들어 배포하는 법을 배웠는데, 나중에 꼭 필요한 기능이라 알아두면 좋을 것 같다는 생각을 했습니다. Metric Type과 Metric 구성을 명확히 알고 사용해야 할 것 같습니다.
아래 주소에서가 Prometheus Python 코드 예제입니다.
GitHub - prometheus/client_python: Prometheus instrumentation library for Python applications
Prometheus instrumentation library for Python applications - GitHub - prometheus/client_python: Prometheus instrumentation library for Python applications
github.com
반응형'데이터 엔지니어링 > Prometheus' 카테고리의 다른 글
[Prometheus] Service Discovery 파일 기반 Config파일 작성하기 (0) 2022.12.21 [Prometheus 개념] Jobs, Instances, Group에 대해 알아보기 (0) 2022.12.21 [Prometheus] Prometheus와 Grafana 연동하고 Node_exporter 대쉬보드 만들기, Grafana Dashboard( (0) 2022.12.19 [Prometheus] 다른서버에 exporter를 설치하고 Prometheus서버에 연결해보기 (0) 2022.12.19 [Prometheus] Prometheus 설치하고 간단하게 사용법 알아보기(with Ubuntu) (0) 2022.12.19